Unlocking Performance: Introducing Perch’s New Performance Scores
The weight room is full of data. Bar speed, volume, load, power output, every rep tells a story. But as the world races toward more and more data, coaches are often left with endless metrics and no clear answers. The result is noise instead of clarity.
Despite the wealth of information, it’s still difficult to answer the most important questions in a timely and efficient manner:
- Are my athletes actually improving?
- Who needs more attention?
- Who is ready to perform?
- How does athlete X compare to athlete Y?
- Is my program having the right impact?
Answering these questions can take too long, or worse, never happen at all.
That’s why we built Perch Performance Scores, to turn complexity into clarity.
These new metrics cut through the noise and provide instant insight. Total Performance, Strength, and Speed Scores give coaches a high-resolution view of progress, adaptation, and readiness. With them, you can train with more precision, intervene earlier, and unlock the full potential of every athlete, every session.
These are more than just numbers. They are tools designed to empower coaches to make smarter, faster decisions and drive better outcomes on and off the field.
The Load Velocity Profile: A Powerful, But Complicated Foundation
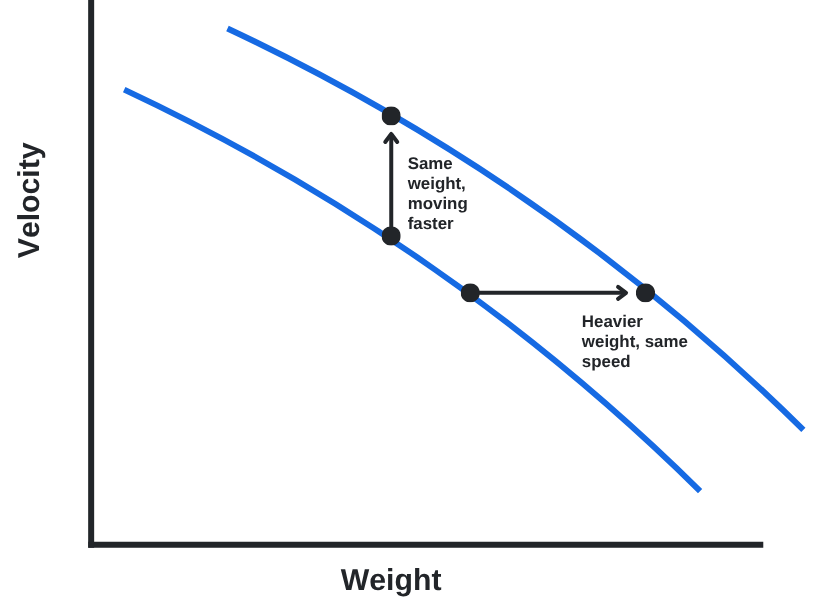
Velocity-based training has revolutionized the way we assess athlete development. At the center is the Load Velocity (LV) profile, a curve that maps how fast an athlete moves various weights, capturing both strength and speed capabilities.
As the curve shifts up and to the right, it shows that your athletes can either move the same loads faster or handle heavier loads at the same speed, both indicators of improved performance.
But while powerful, LV curves are complex. What coaches need is a way to translate this curve into simple, reliable numbers, metrics that make it easy to track progress, benchmark performance, and identify training needs without diving into data every day.
Meet the Scores
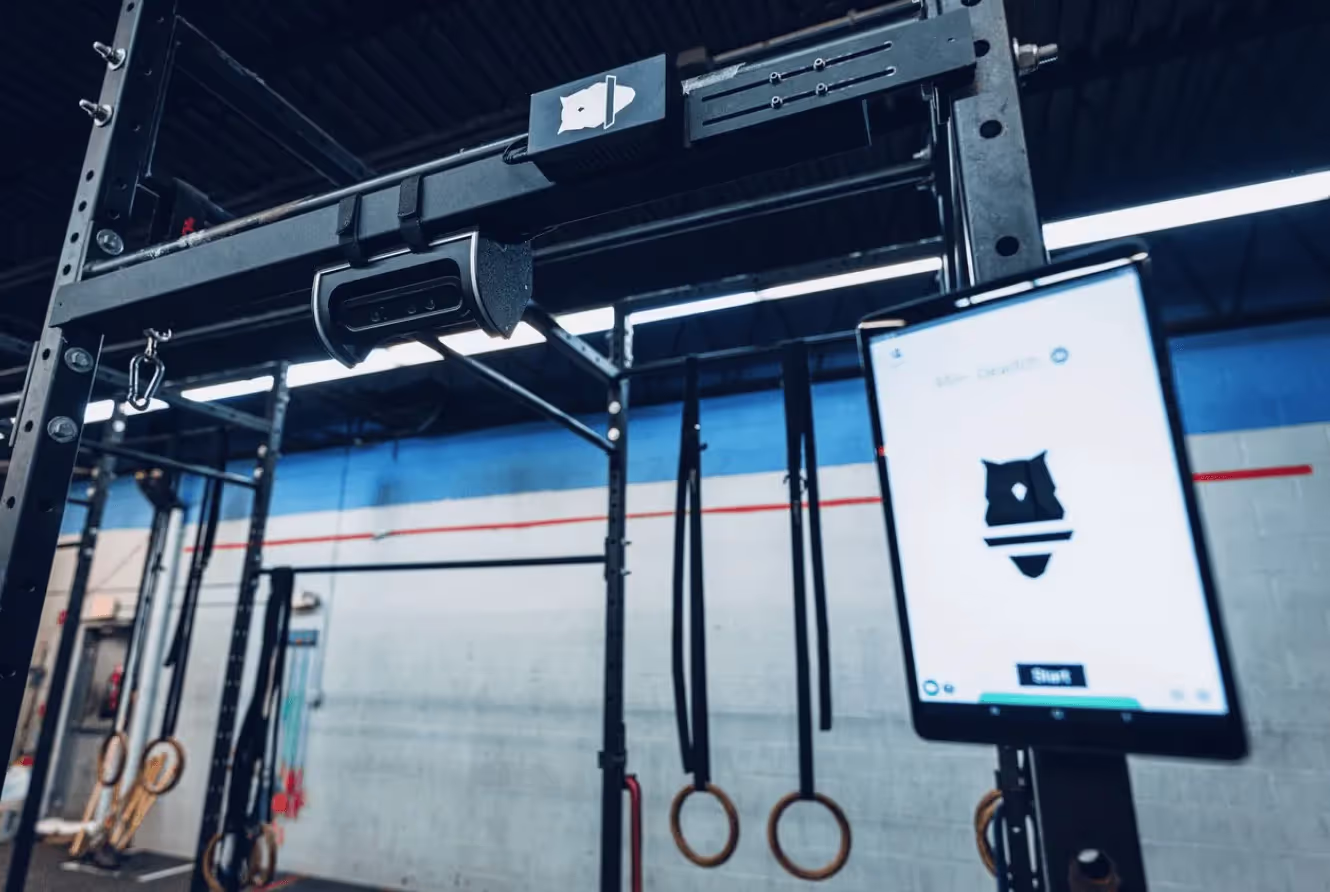
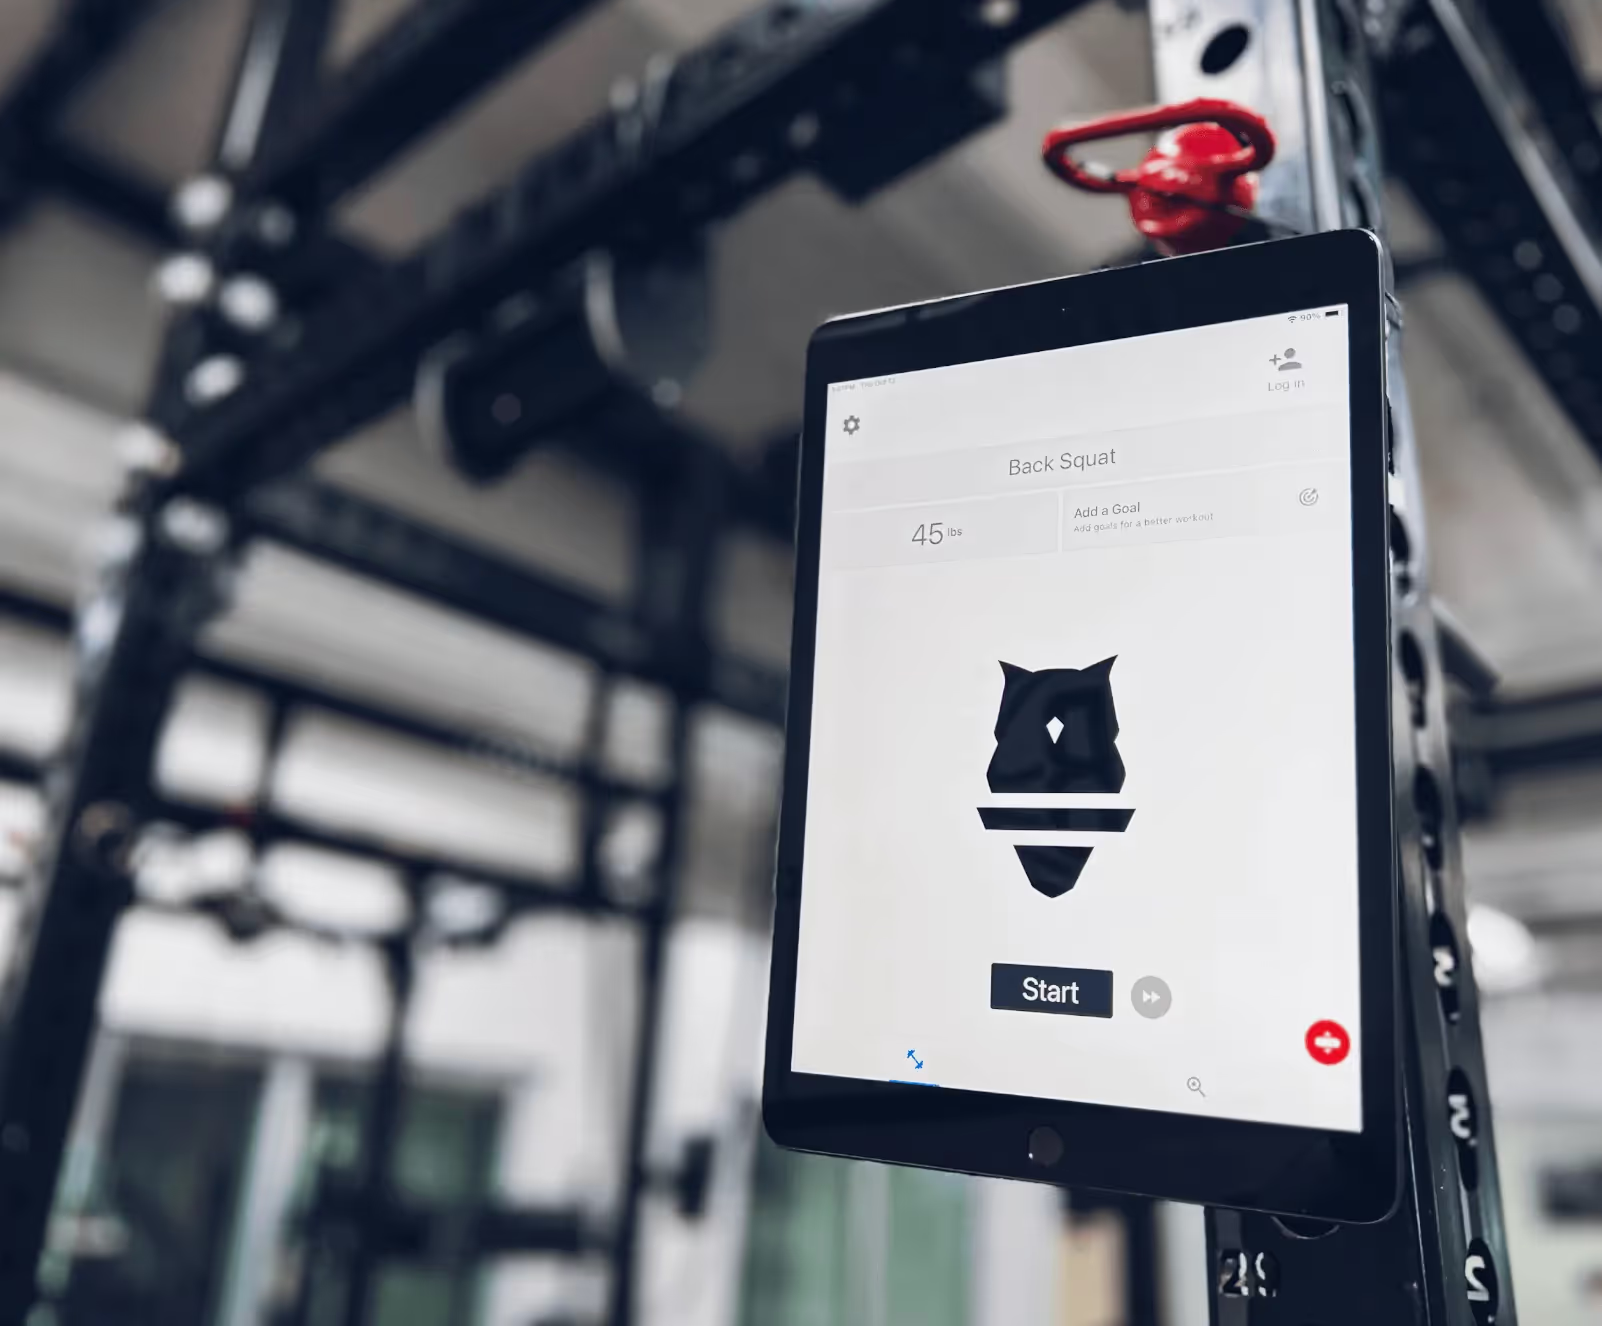
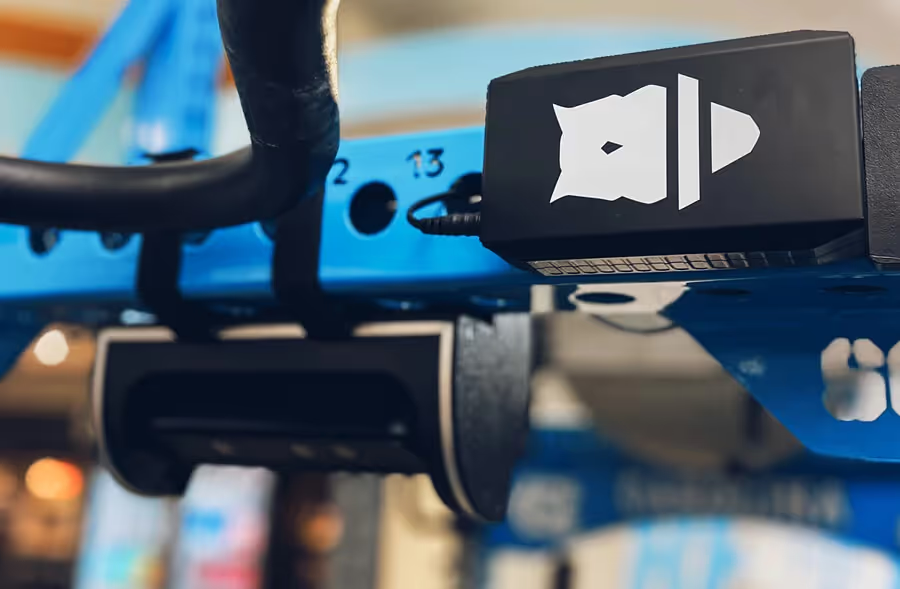
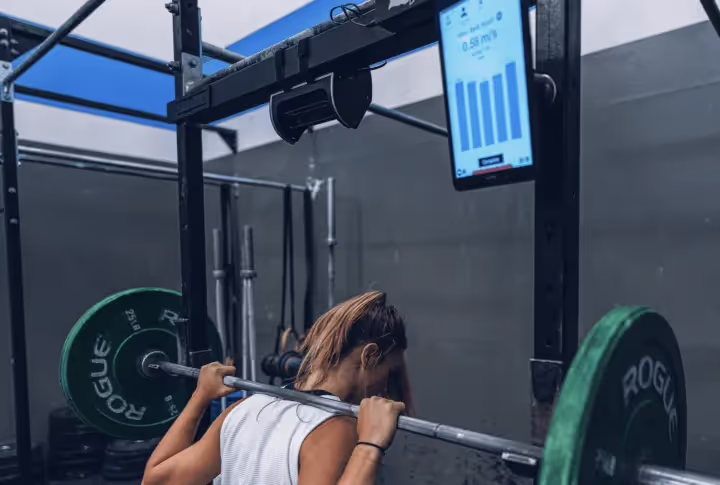
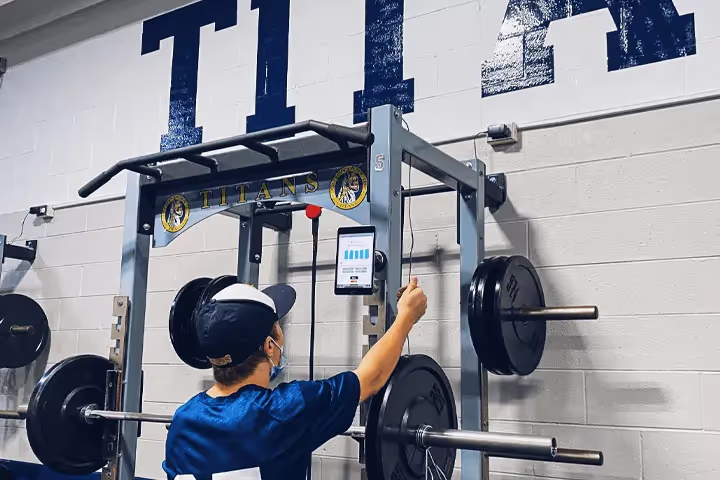
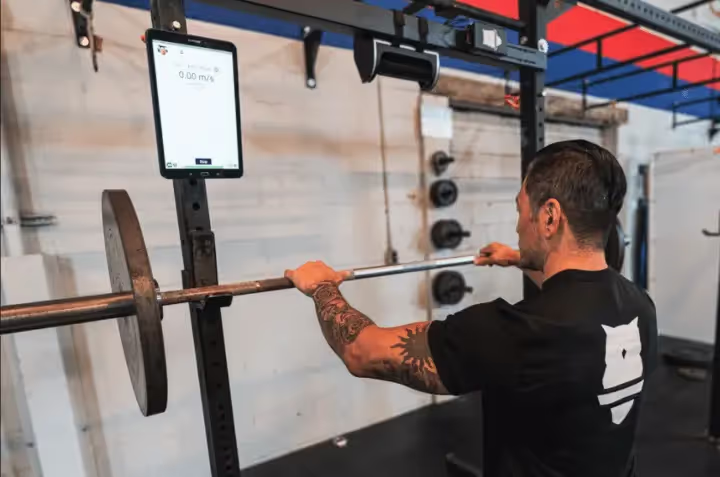
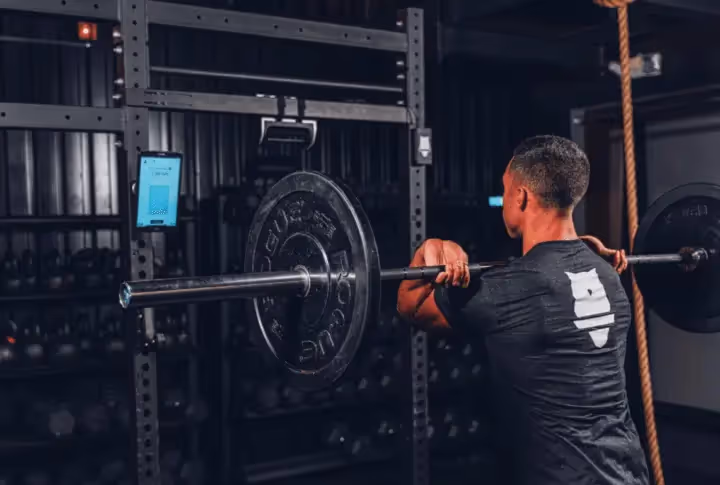
Perch Performance Scores help you identify and track how athletes are adapting to training. Derived directly from Load Velocity (LV) profiles, these scores are available for every exercise Perch tracks. And because Perch computes these LV curves automatically, there is no special testing required.
With three distinct metrics to analyze, you can monitor speed, strength, and overall athletic development over time and gain clear insight into how your program is impacting athlete performance in the weight room.
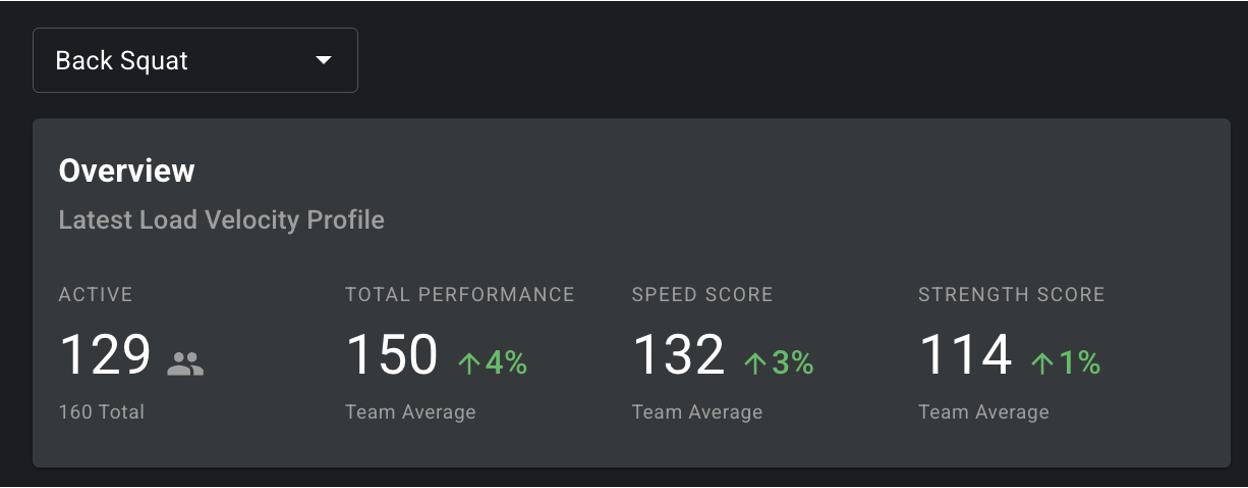
Strength Score
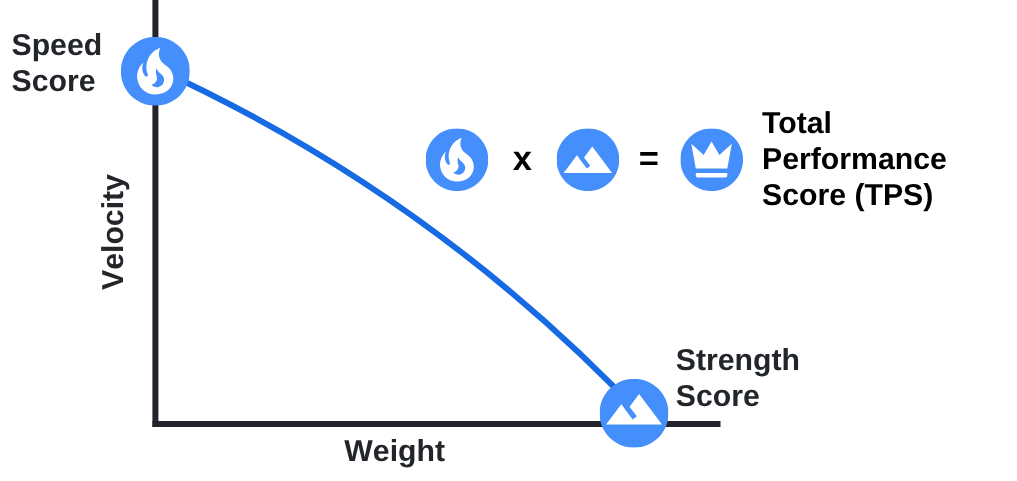
Strength score represents an athlete's general overall strength. It is a normalized measurement (z-score) of where the athlete's Load Velocity Profile meets the X axis, similar to an estimated one rep max. The higher the strength score relative to others in their group, the stronger they are in their population.
Speed Score
Speed score represents an athlete's explosiveness. It is a normalized measurement (z-score) of where the athlete's Load Velocity Profile meets the Y axis, also known as the X-zero or the unloaded max velocity. The higher the speed score relative to others in their group, the more explosive they are in their population.
Total Performance Score (TPS)
Total performance score represents an athlete's overall ability, determined by equally weighting Strength and Speed Scores. As the athlete's profile shifts up and to the right, the Total Performance Score will increase, indicating an improvement in both speed and strength.
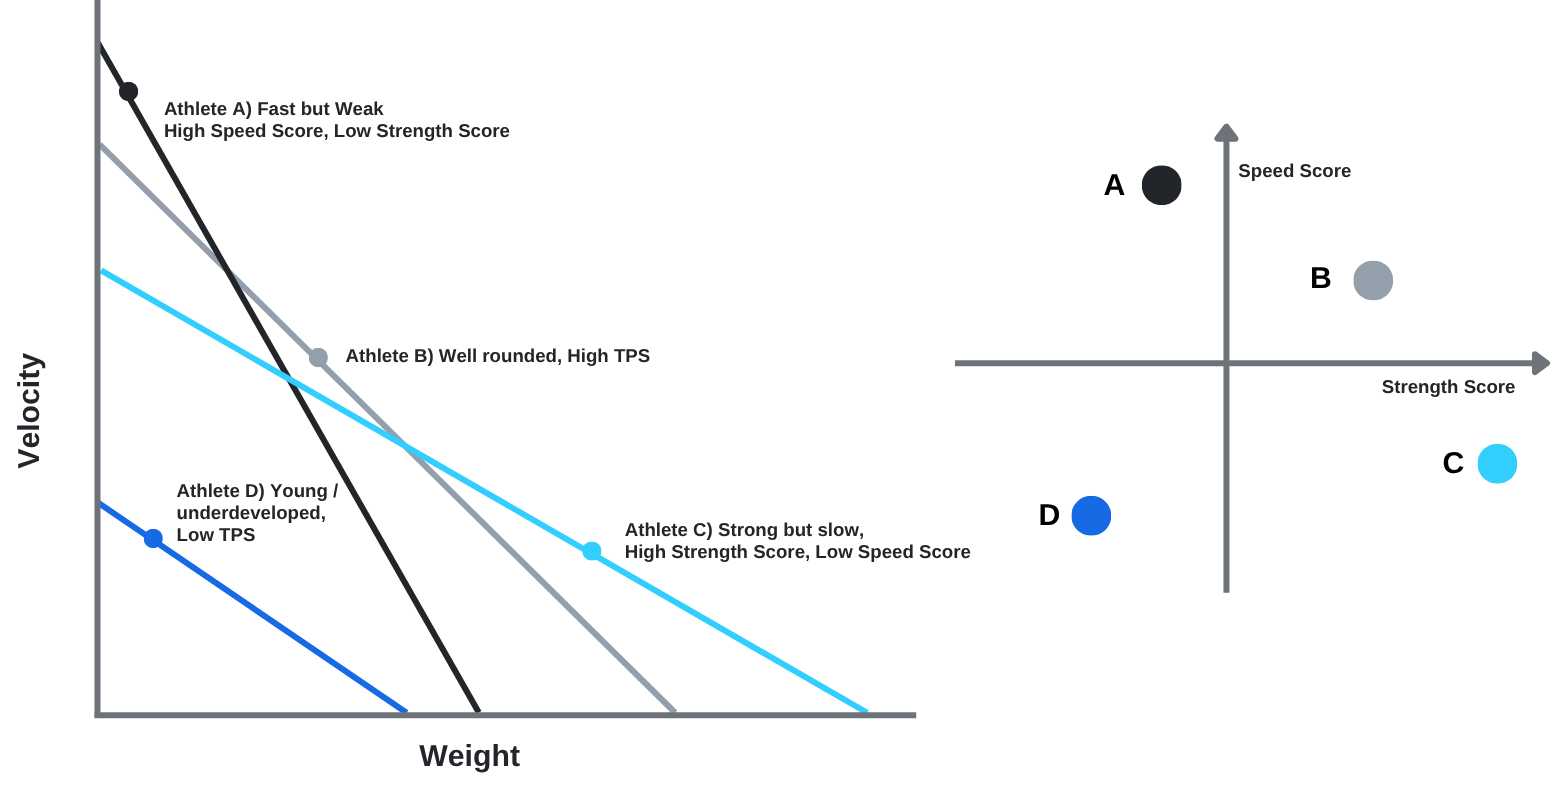
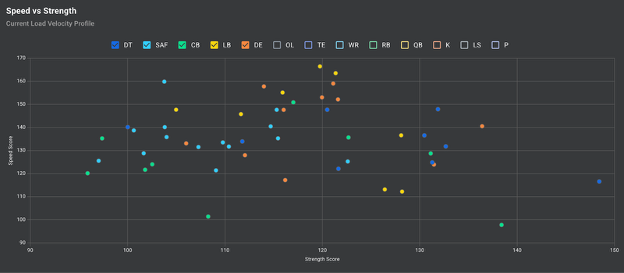
These scores are especially valuable for profiling athletes over time, comparing them to peers in similar positions or age groups, and monitoring individual development.
Take the example below, as each athlete’s Load Velocity curve shifts, it becomes difficult to intuitively determine whether they are load- or speed-deficient, how they compare to their peer group, or how their performance is evolving. Performance Scores solve this by converting those complex curves into simple, comparable numbers, making it far easier to identify trends, detect outliers, target interventions effectively, and compare athletes to one another.
Real-World Use and Benefits
With Performance Scores, you can:
View team level performance and trends at a glance.
Quickly Visualize multiples athletes’s performance over time and spot who is improving or declining
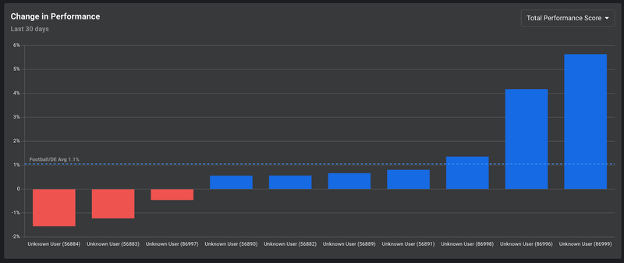
Benchmark athletes across teams, positions, or training phases, determining how they may be deficient relative to peers and where you need to focus future program design.
And so much more.
What’s Next
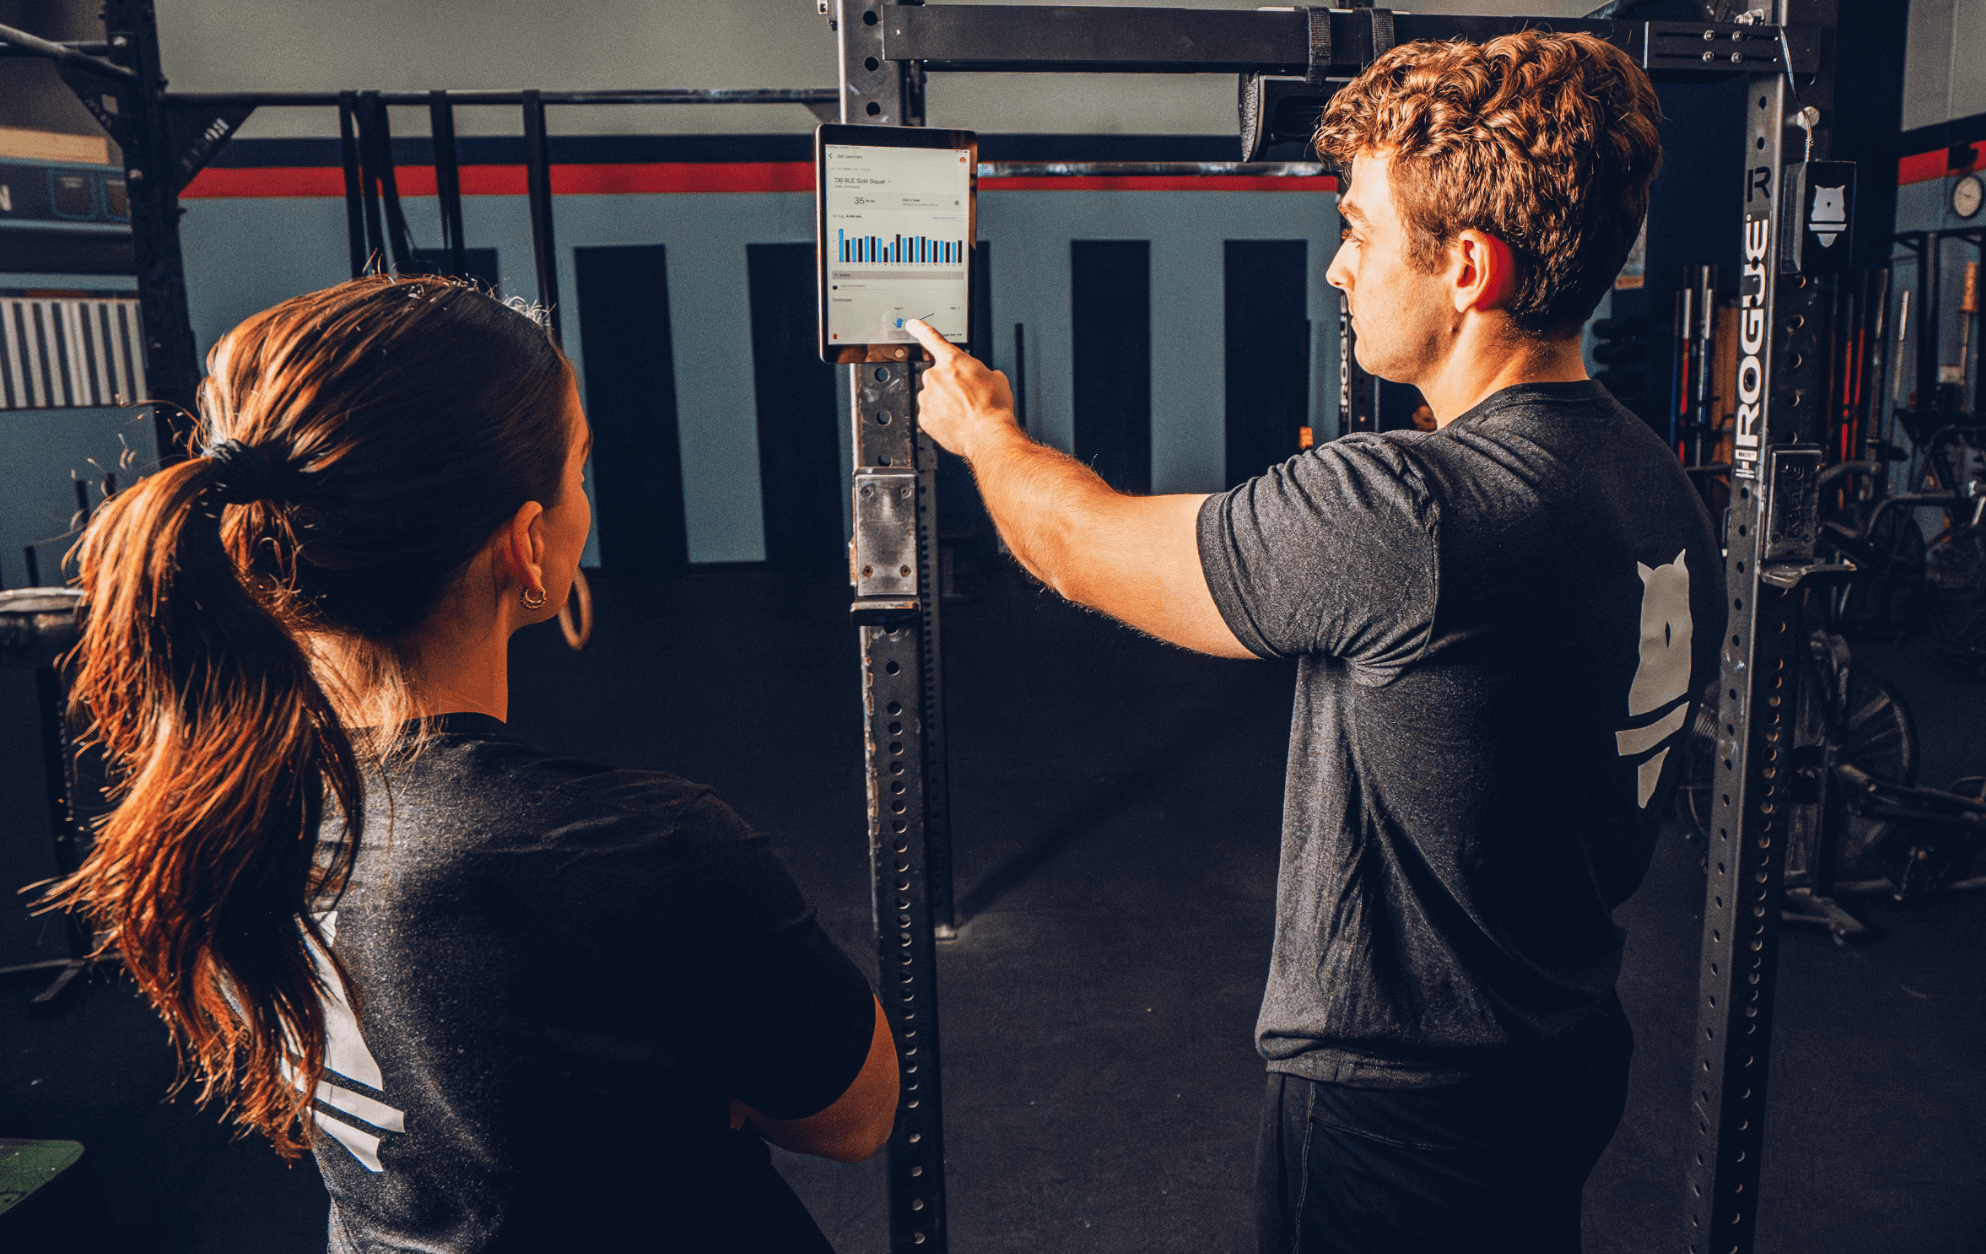
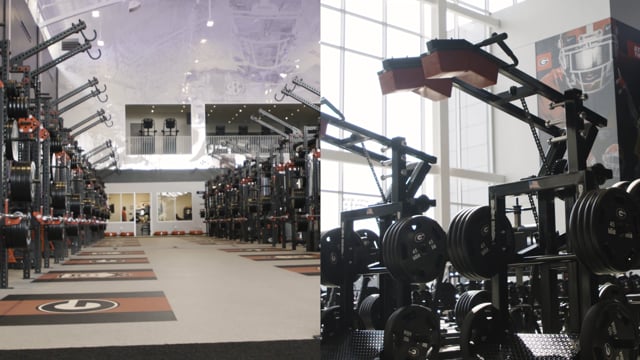
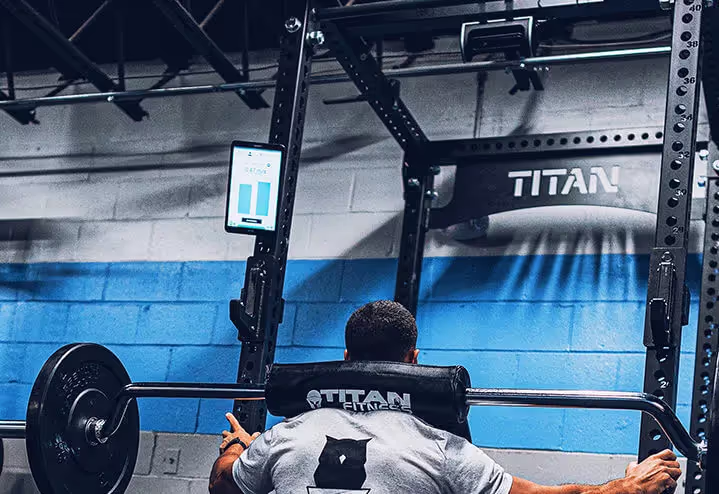
You can start exploring these metrics today inside the Team Exercise Dashboard. Examples of visuals from this dashboard are shared above.
And this is just the beginning. In the months ahead, we will be rolling out deeper benchmarking capabilities, more position-specific insights, and new layers of intelligence to help you fine-tune every aspect of your program.
Ready to dive in?
Log in to your dashboard and see how your athletes stack up. Have questions or want to go deeper? Reach out, we are here to help.


Further Reading


This AI is Taking Over the Sports World
This AI is Taking Over the Sports World... Every now and then, the sports world gets introduced to a new technology that absolutely changes the game. With professional sport currently operating at a more competitive level than ever, we have a question for you all. What’s the most important factor for teams to focus on?
NBA's Nets, Pistons, Heat and Magic using Perch's AI-powered weight training platform

NBA Teams Embrace AI Weightlifting Tech From Perch

Meet the BostInno 2023 Fire Awards Honorees
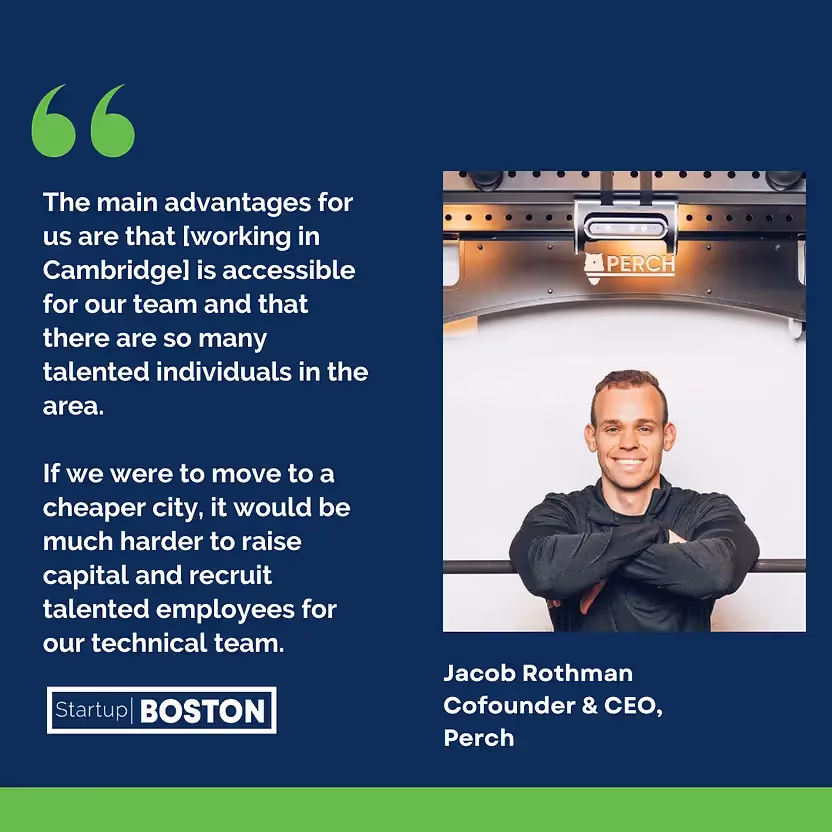
They may work out of a Cambridge office, but Perch is working on the field, pitch, and court. A growing number of teams in the NFL, NBA, NHL, MLB, MLS, and NCAA use Perch’s AI-backed weight training platform to monitor player movements during exercises and enhance their motivation, safety, and performance.

Perch Revolutionizing the Way MLS Teams Train in Weight Room
U of L men’s basketball has been utilizing an AI-backed weight training platform this offseason
U of L men’s basketball has been utilizing an AI-backed weight training platform this offseason. The next time Louisville men’s basketball takes the court, how they fare will, in large part, depend on the play of their revamped roster. But their success also hinges on a new AI-backed weight training platform.


Burning Questions with New England Based Innovators: Perch’s Founder, Jacob Rothman
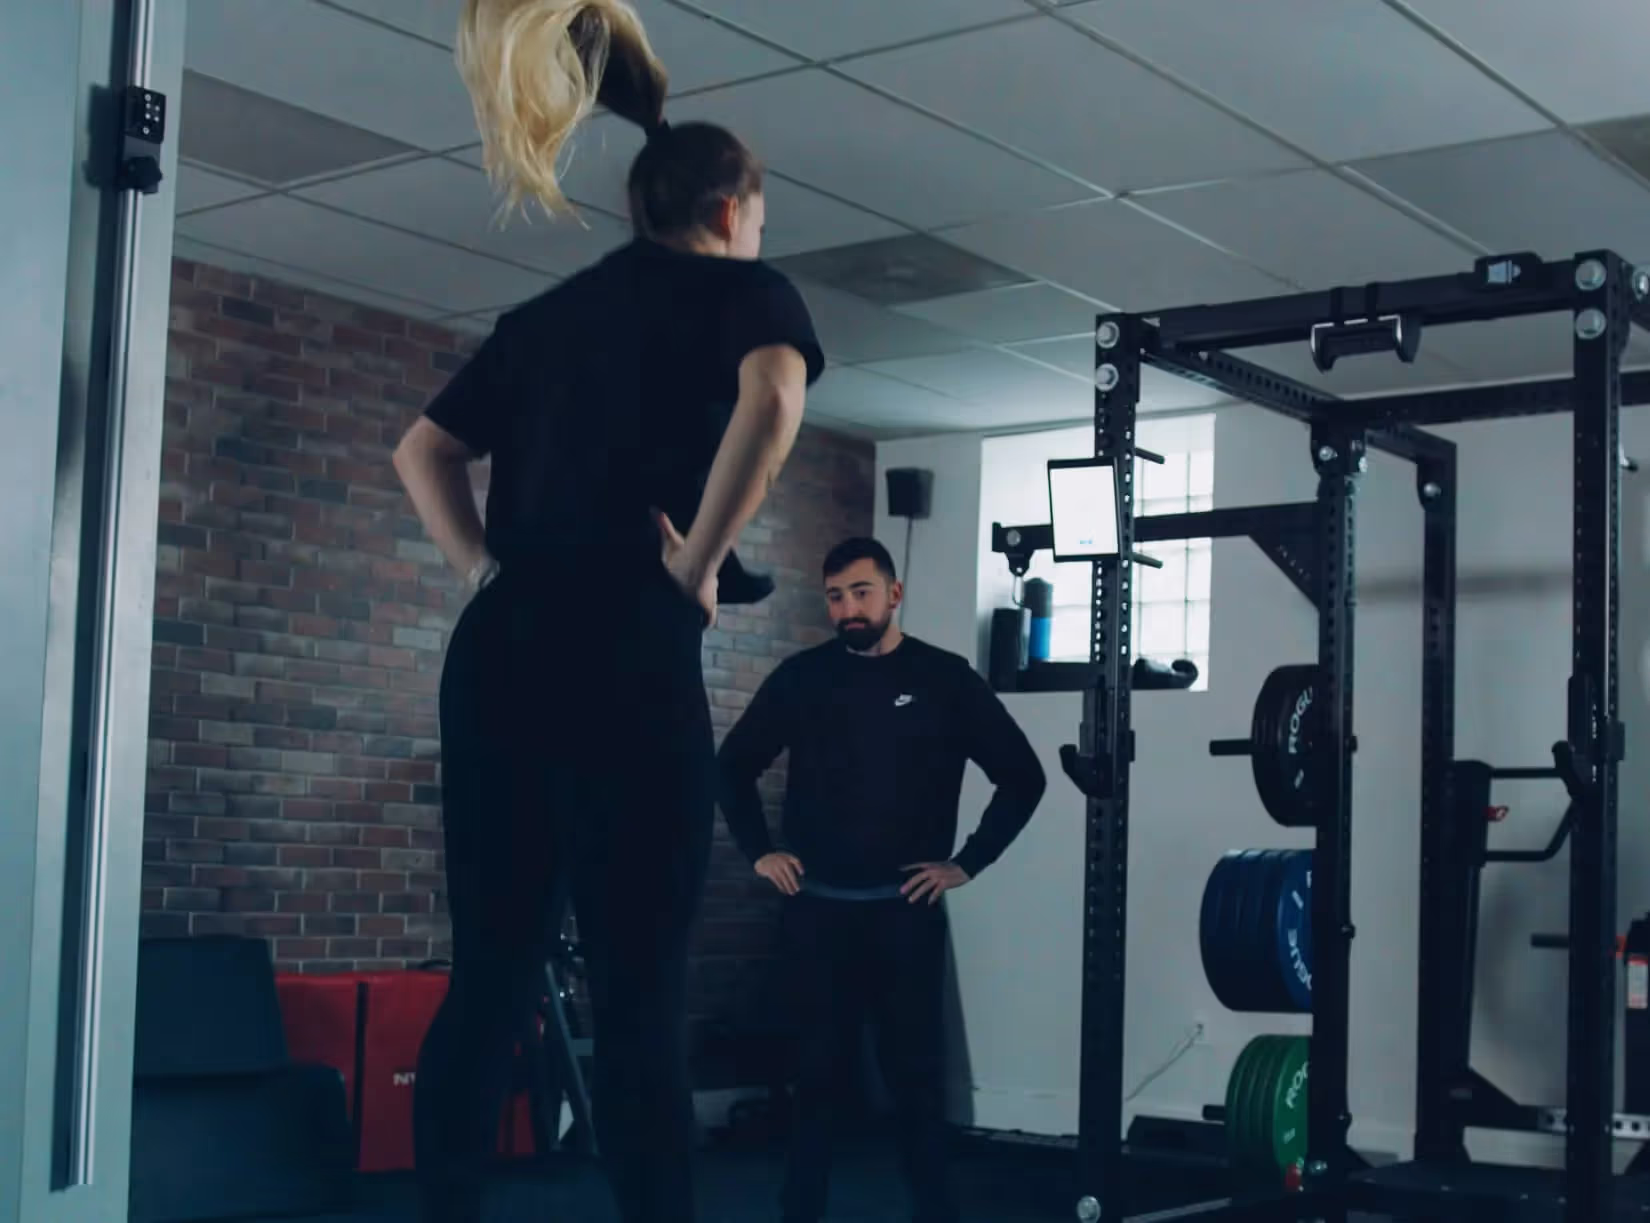
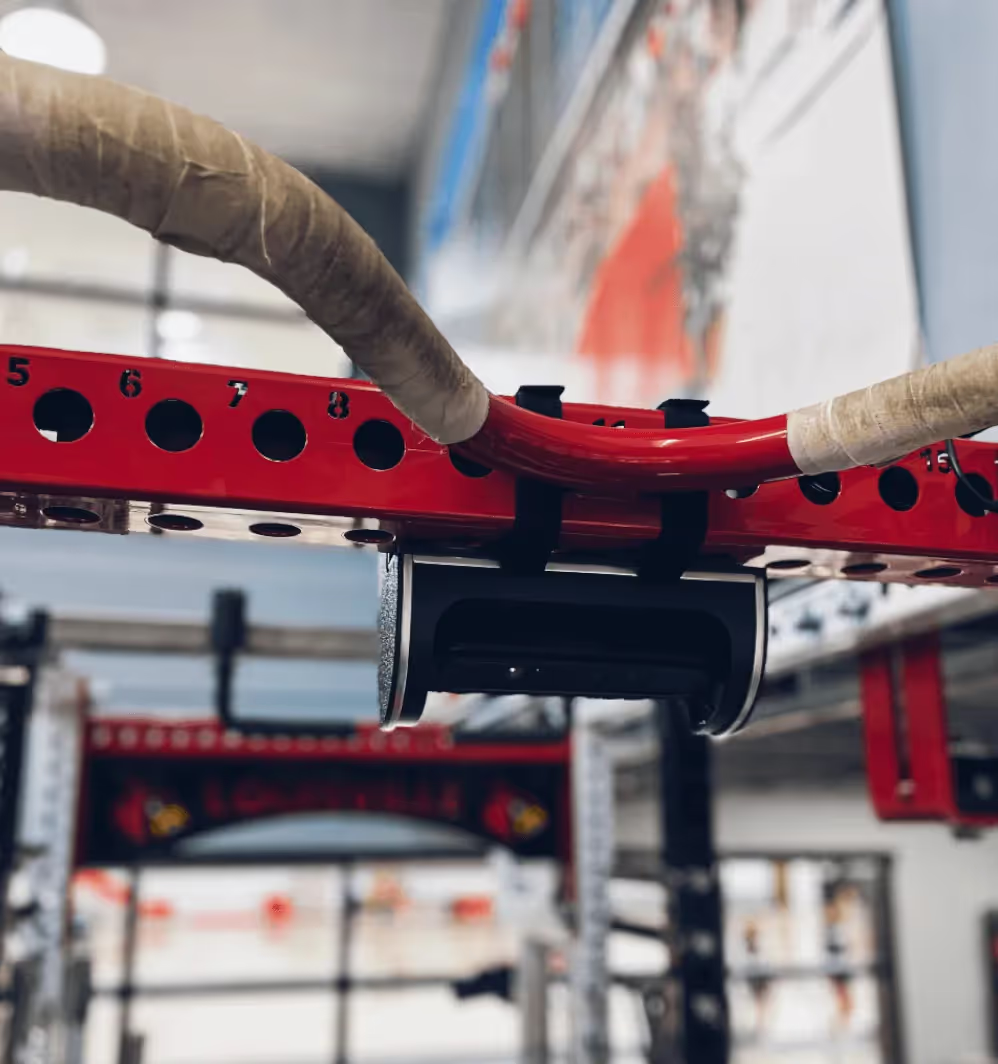
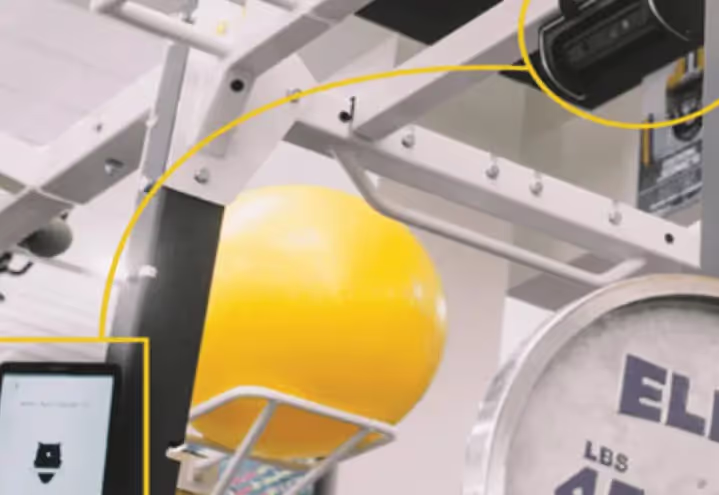
Jacob Rothman and his co-founder created Perch, a company with the goal of making the world a stronger place. Perch enables athletes and coaches to effortlessly quantify weight room performance through a camera enabled device and software. This provides groundbreaking insights to their clientele through the use of AI in their tech stack.


The Future of Sports: Jacob Rothman of Perch On The New Emerging Technologies That Are Disrupting The World Of Sports
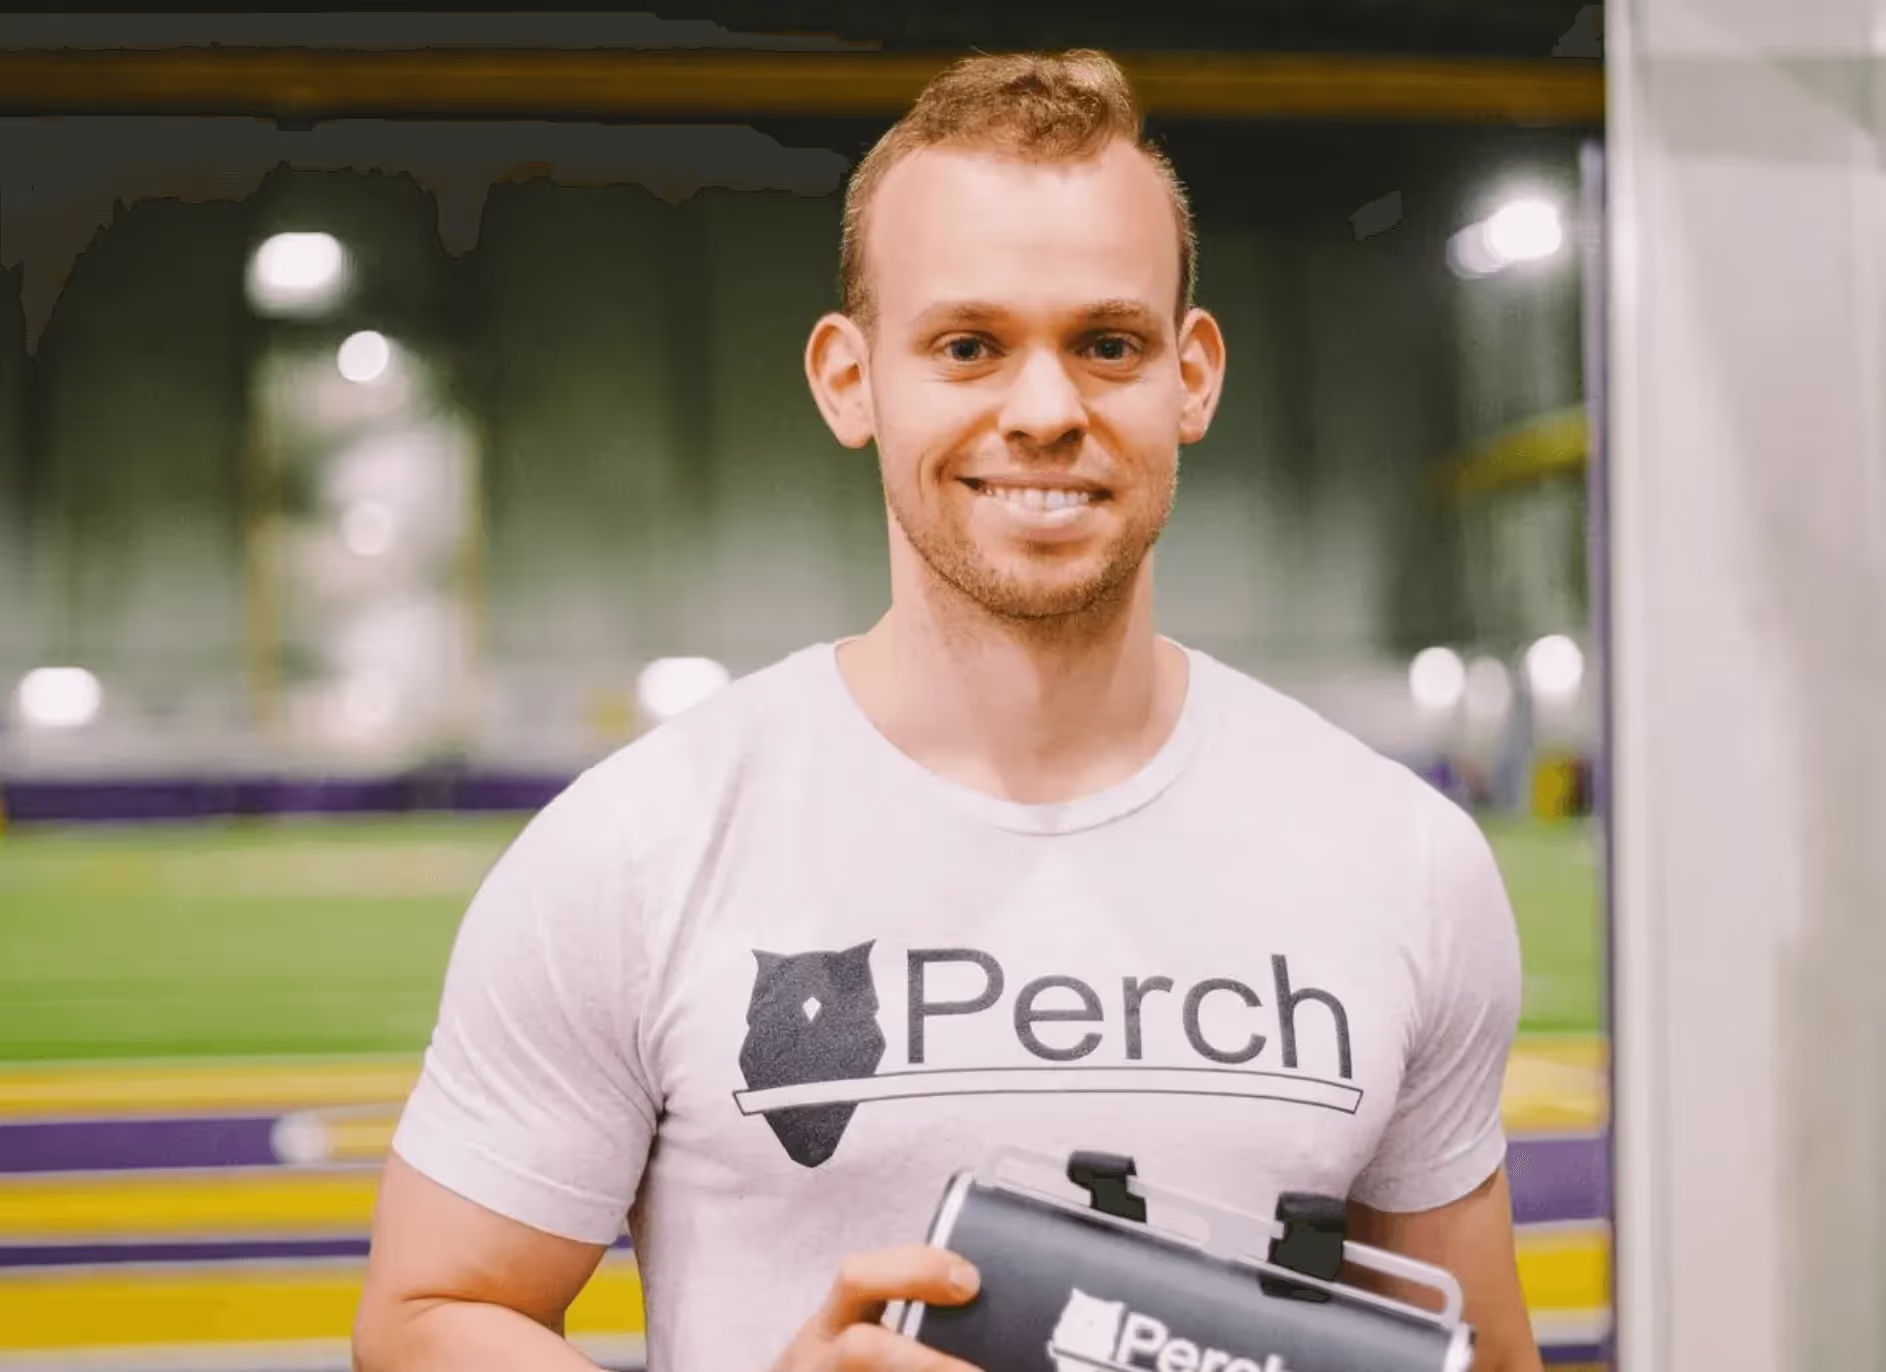
Asa part of this interview, we had the pleasure of interviewing Jacob Rothman, co-founder of Perch. Jacob Rothman was an MIT varsity athlete when he herniated a disc in his back during a routine workout. While recovering from his injury, he started to brainstorm ideas for a device that could help athletes better quantify workouts in the weight room

Perch Weight Room Technology Launches Rack Integration with Life Fitness and PLAE
Perch – the first and only piece of weight room technology built for athletes and coaches – has announced a weight rack integration launch with Life Fitness and PLAE, giving users of the equipment an opportunity to elevate their weight room experience by quantifying performance with velocity-based training.

How college football's national champion Georgia Bulldogs are leveraging Perch's 3D camera in the weight room


Perch Announces Investment Partnership with Miami Dolphins CB Byron Jones
Jacob Rothman revolutionizing sports industry with Perch
The journey through life offers many twists and turns. For 2016 MIT graduate Jacob Rothman, his journey has helped him become a revolutionary in the sports and tech world. Rothman first fell in love with sports, specifically baseball, in Charlotte, North Carolina. It was one of the most popular sports where he grew up.

Perch Raises $4 Million Funding Round
Perch, an MIT-developed technology that is helping a growing number of professional and collegiate athletic programs improve overall performance in the weight room and on the field, today announced the raise of a $4 million financing round. This brings the total amount raised by the company to $6 million since the company’s founding in 2017.

Perch Raises $4m For 3d Strength Tracking
Velocity-based training is flexing its strength. For context: Tried and true, for decades, strength and conditioning revolved around percentage-based training — where intensity and load are prescribed relative to an athlete’s one-rep maximum weight. Now, new research suggests that velocity-based training (VBT)—focused on measuring and improving...
Train Smarter With This Cambridge Startup’s Weight Room Tech
A new technology is coming to the weight room. Founded by three MIT athletes, Cambridge-based Perch uses computer vision and machine learning algorithms to monitor an athlete’s movements during exercise in the gym. The startup recently raised a $4 million round from investors like Bradley Bloom, Ledgeways Ventures LLC and Byron Jones...
Weightlifting Camera And Data Company Perch Raises $4 Million Funding Round With Miami Dolphins’ Bryon Jones Among New Investors
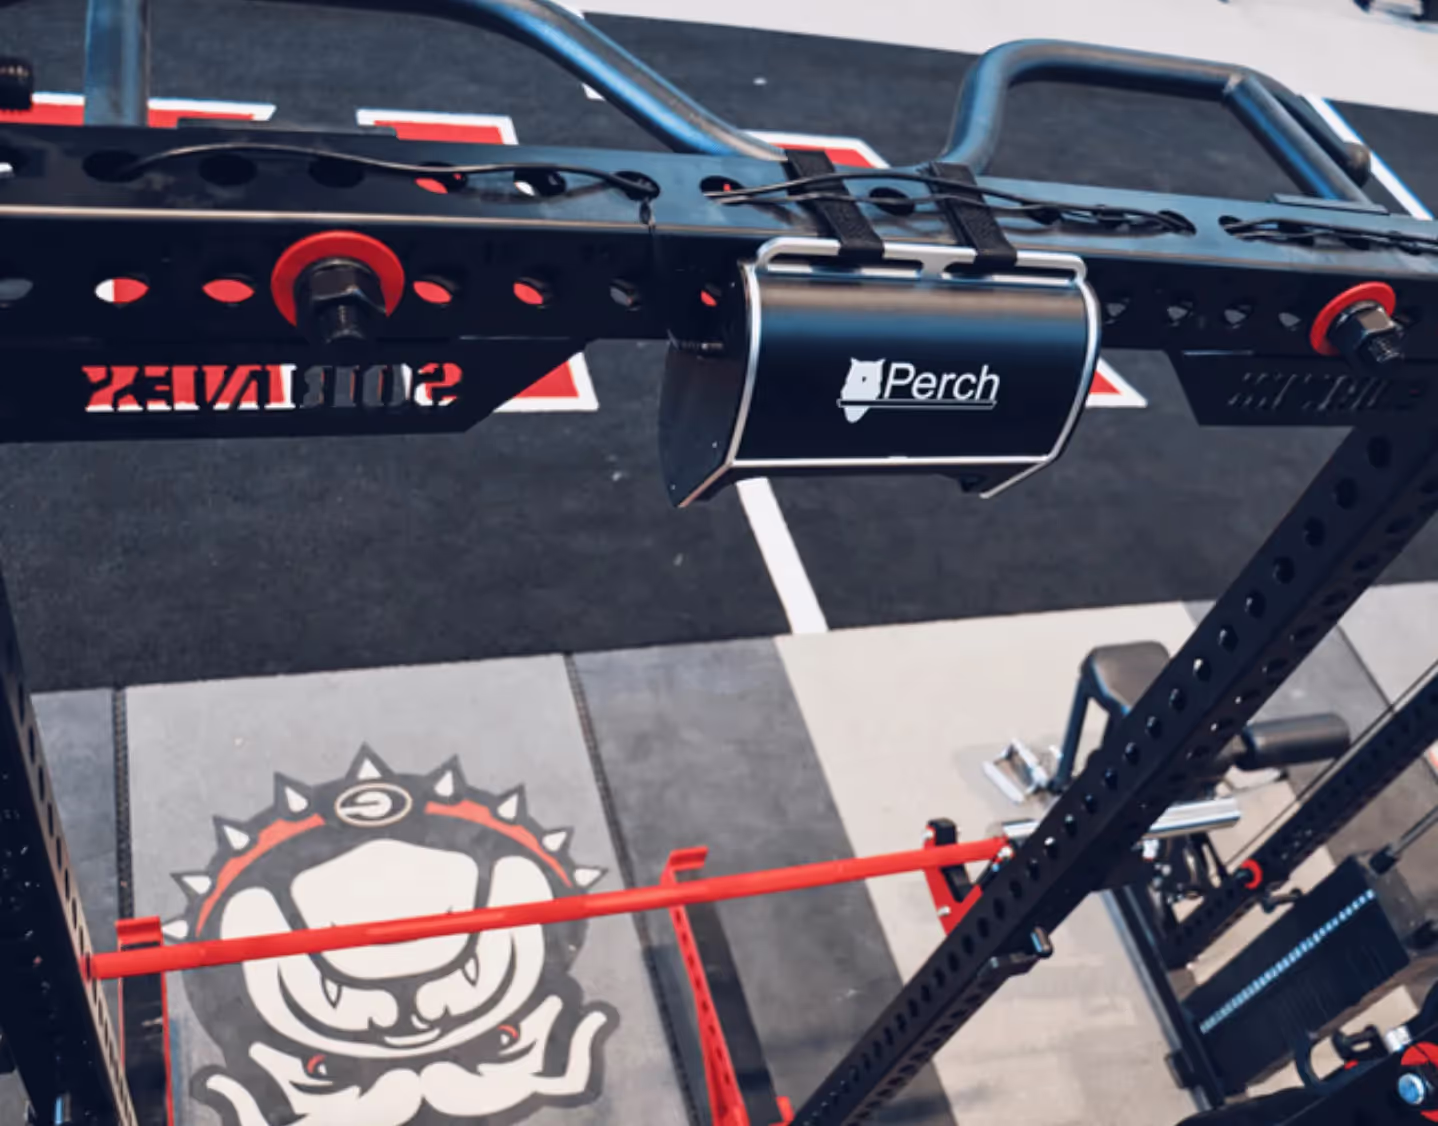
Weightlifting camera and data company Perch has raised a new $4 million funding round that includes investment from Miami Dolphins cornerback Byron Jones. Perch makes a 3D camera that straps to weight racks to track an athlete’s movements as they lift, including calculating sets, reps, velocity, and power output via Perch’s connected app.
Perch Is Changing The Game Of Velocity-based Training
Dubbed as an “invaluable addition” to their training program by the Orlando Magic, weight training platform Perch has pulled in a number of new users in NFL and NCAA football and basketball teams. Among those teams include the New England Patriots, Pittsburgh Steelers, Baylor Bears (Men’s Basketball), and North Carolina Tar Heels.
Spotlight: Perch Offers A New Type Of Fitness Tracker
Tech entrepreneurs are disrupting the fitness industry in a number of ways. One of the most prominent is the production of devices that can measure steps and other vitals. But these are often geared more toward cardio exercises. Now, Perch offers something similar for strength training exercises. Read about this new innovation in this week’s...


.avif)

Training Like The Pros: Glenbrook South Using Mit-developed Tech
Glenbrook South is one of a few high schools in the country utilizing equipment adopted by the NFL, MLB, NHL, MLS, NBA and NCAA. The GBS athletic program installed some new state-of-the-art technology in the weight room last summer. With a fall sports season about to conclude, Perch has been paying off.


To Protect And Progress: Glenbrook South Student-athletes Lifting Faster, Smarter, Thanks To New Weight Room Tech
This school year Glenbrook South implemented a new piece of equipment in its weight room designed to monitor and improve training results without beating people up. The MIT-developed Perch system consists of a 3D camera that straps to a weight rack -- it's on all 14 racks in Glenbrook South's weight room -- and a computer...

Exclusive: Saints Install Perch’s 3D Camera Technology
The New Orleans Saints have become the latest client for the 3D camera technology in their workout facility. The technology helped to propel LSU to their 2019 National Championship. Perch co-founder Jacob Rothman recently met with the New Orleans Saints and head strength and conditioning coach Dan Dalrymple. Perch installed their 3D camera...
How the Saints are using 3D cameras and motion tracking in the weight room to gain an edge
The New Orleans Saints are not necessarily trying to make bionic men, but they are feeling around on technology’s leading edge to help their players uncover their peak form in the weight room. So, roll with Saints longtime strength and conditioning coach Dan Dalrymple as he puts on his best cinematic voice. “We have,” he said with a dramatic...
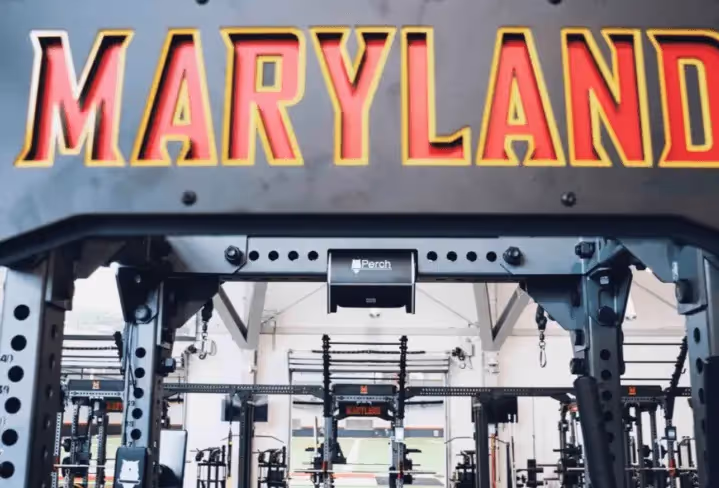
Terps Install 3D Cameras On Weight Racks To Assure Safe Lifting
The University of Maryland Terrapins football team installed 3D cameras on its weight racks this month to help student-athletes lift safely. The cameras track their movements and help the players achieve proper form. This could reduce the risk of lifting injuries. The technology, called Perch, was developed by a former varsity athlete at the...

LSU Football Trainer Jack Marucci Transitioning to Director of Performance Innovation
LSU is in the market for another key position on its staff. On Wednesday the program announced that longtime Director of Athletic Training Jack Marucci, would be transitioning to a new role within the athletic department. Marucci will take over as Director of Performance Innovation for the program, where his primary focus will be to hone in on...
Meet Perch, the new weight room staple that’s becoming a game-changer in the SEC and beyond
Jacob Rothman wasn’t a massive college football fan. He was just your standard MIT graduate/ex-college baseball player who wanted to change the way people lifted weights. But when longtime LSU strength and conditioning coach Tommy Moffitt made the Tigers the first collegiate or professional sports team to roll the dice on Rothman’s new...
Perch Weight Room Tech Added to More NFL, College Football Facilities
The Jacksonville Jaguars, Seattle Seahawks, Ole Miss Rebels and Georgia Bulldogs are the newest professional and college football teams to equip their exercise facilities with Perch, an AI-backed weight training platform that tracks performance during workouts. Those teams join the New York Giants, Tennessee Titans, Miami Dolphins and LSU Tigers...
Weight Room Technology Boosts Sports Performance
In weight rooms across the country, top-flight sports teams are generating data from student-athletes beyond just how much weight is on the bar and how many times they can lift it. "Right now, you go to the weight room and you lift weights, the information you have access to is your sets, your reps and how much weight you moved," says...

MIT spinoff brings artificial intelligence to the weight room
In January, 2019, a Cambridge startup called Perch sold the Louisiana State University football team on a new weight training system that uses video cameras and artificial intelligence software to boost athletic performance. One year later, the Tigers won the national championship of college football.

Pro And College Teams Use New Workout Device That Enables ‘Smart’ Weight Racks
Jacob Rothman, a first and third baseman at MIT, herniated a disc in his back while doing a warm-up set of squats during the summer after his freshman year. Though that helped end his baseball career, it helped launch a new technology. He and two fellow MIT students started working on Perch in 2016. With Rothman’s own physical therapy and...

Perch is Reinventing the Weight Rack and Helping Athletes Train Smarter
An MIT-developed technology is helping a growing number of players and coaches – including those in the NFL, NBA, NHL, MLB, MLS, and Power Five conferences – improve overall performance in the weight room and on the field. Named Perch, the device uses a combination of cameras and machine learning to monitor movements during exercise and enhance...


LSU Football Strength Coach Tommy Moffitt Recaps First Week of Workouts, How Technology Has Helped in Return
Technology like Perch allows coaches and athletes to determine the speed of movement in real time and adjust the weight or exercise accordingly. "Using the velocity-based system we have, Perch, we knew all of the sets and all of the reps and all of the velocities the guys were doing before we left."


An Inside Look at the Technology That Will Help LSU Football Return to Peak Physical Condition
Discovering a baseline for each athlete—whether it's an incoming freshman or a returning player—is just another way in which the Perch technology will help LSU in the coming weeks as it attempts to get its players back in shape. What Perch allows is for strength coaches like Moffitt and Jacobs, as well as each individual athlete, to find the...


Start Gathering Data With Perch Today!
Reach out to us to speak with a representative and get started using Perch in your facility.